Powered By Blogger

Tuesday, October 19, 2010

~~INTRODUCTION OF XML~~
Extensible Markup Language (XML) is a set of rules for encoding documents in machine-readable form.
XML's design goals emphasize simplicity, generality, and usability over the Internet.[6] It is a textual data format with strong support via Unicode for the languages of the world. Although the design of XML focuses on documents, it is widely used for the representation of arbitrary data structures, for example in web services.

~~THE DIFFERENCE BETWEEN XML AND HTML~~

  • xml is not a replacement for html
  • xml was designed to transport data while html was designed to display data
  • html is about displaying information, while xml is about carrying information


XML TABLE

Molecular Mechanics Semi Empirical Ab Initio
Very Fast Speed Fast Speed Slow Speed
Restriction Parameters Good Accuracy Very Good Accuracy
Very Good Protein Modelling Good Protein Modelling Best Protein Modelling


XML DOCUMENTS


<Molecular mechanics="”Very fast speed">
Fast Speed
Slow Speed
< /Molecular Mechanics>
< Molecular mechanics="”Restriction">
Good Accuracy
Very Good Accuracy
< /Molecular Mechanics>
<Molecular mechanics="”Very">
Good Protein Modelling
Best Protein Modelling
< /Molecular Mechanics>


XML TREE

Sunday, October 17, 2010

~~pDb~~


DO YOU KNOW WHAT IS PDB??
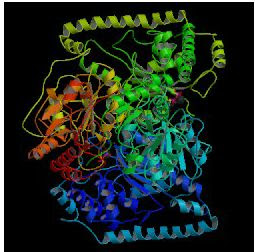
PDB IS A Protein Data Bank (PDB) that is for a repository for the 3-D structural data of large biological molecules, such as proteins and nucleic acids. (See also crystallographic database). The data, typically obtained by X-ray crystallography or NMR spectroscopy and submitted by Biologist and biochemists from around the world, are freely accessible on the internet. The PDB is overseen by an organization called the Worldwide Protein Data Bank, wwPDB. The PDB is a key resource in areas of structural biology, such as structural genomics. Most major scientific journals, and some funding agencies, such as the NIH in the USA, now require scientists to submit their structure data to the PDB. If the contents of the PDB are thought of as primary data, then there are hundreds of derived (i.e., secondary) databases that categorize the data differently. For example, both SCOP and CATH categorize structures according to type of structure and assumed evolutionary relations; GO categorize structures based on genes.

HISTORY OF PDB.

The PDB originated as a grassroots effort. In 1971, Walter Hamilton of the Brookhaven National Laboratory agreed to set up the data bank at Brookhaven. Upon Hamilton's death in 1973, Tom Koeztle took over direction of the PDB. In January 1994, Joel Sussman was appointed head of the PDB. In October 1998,[2] the PDB was transferred to the Research Collaboratory for Structural Bioinformatics (RCSB); the transfer was completed in June 1999. The new director was Helen M. Berman of Rutgers University (one of the member institutions of the RCSB).[3] In 2003, with the formation of the wwPDB, the PDB became an international organization. Each of the four members of wwPDB can act as deposition, data processing and distribution centers for PDB data. The data processing refers to the fact that wwPDB staff review and annotates each submitted entry. The data are then automatically checked for plausibility. (The source code for this validation software has been made available to the public at no charge.

CONTENT

Experimental
Method
Proteins Nucleic Acids Protein/Nucleic Acid
complexes
Other Total
X-ray diffraction 55480 1231 2605 17 59333
NMR 7512 925 162 7 8606
Electron microscopy 214 17 77 0 308
Hybrid 24 1 1 1 27
Other 126 4 4 13 147
Total: 63356 2178 2849 38 68421
48,715 structures in the PDB have a structure factor file.
5,901 structures have an NMR restraint file.

These data show that most structures are determined by X-ray diffraction, but about 15% of structures are now determined by protein NMR. When using X-ray diffraction, approximations of the coordinates of the atoms of the protein are obtained, whereas estimations of the distances between pairs of atoms of the protein are found through NMR experiments. Therefore, the final conformation of the protein is obtained, in the latter case, by solving a distance geometry problem. A few proteins are determined by cryo-electron microscopy. (Clicking on the numbers in the original table will bring up examples of structures determined by that method.)

The significance of the structure factor files, mentioned above, is that, for PDB structures determined by X-ray diffraction that have a structure file, the electron density map may be viewed. The data of such structures is stored on the "electron density server", where the electron maps can be viewed.

In the past the number of structures in the PDB has grown at an approximately exponential rate. However, since 2007 the rate of accumulation of new proteins seems to have plateaued, with 7263 proteins added in 2007, 7073 in 2008, and 7448 in 2009.

PDB DATA

Information required includes

  • coordinates of all atoms
  • chemical description of the various molecules in the crystal
  • experimental information about the structure
  • structural description of the biological molecule


Tuesday, October 12, 2010

sMilEs=)


~sMilEs~

when people heard about smiles, they must refer to someone who are smiles to others. however, smiles that i want to share with you is something different from that.

do you know that Smiles is refer to simplified molecular input line entry specification.
The simplified molecular input line entry specification or SMILES is a specification for unambiguously describing the structure of chemical molecules using short ASCII strings. SMILES strings can be imported by most molecule editors for conversion back into two-dimensional drawings or three-dimensional models of the molecules.

The original SMILES specification was developed by Arthur Weininger and David Weininger in the late 1980s. It has since been modified and extended by others, most notably by Daylight Chemical Information Systems Inc. In 2007, an open standard called "OpenSMILES" was developed by the Blue Obelisk open-source chemistry community. Other 'linear' notations include the Wiswesser Line Notation (WLN), ROSDAL and SLN (Tripos Inc).

~~smiles bond~~
smiles bondfigure
single-
double=
Triple#
aromatic:

~~smiles symbols~~
  • string of alphanumeric character and certain punctuation symbols
  • terminates at the first space encountered when read left to right
  • the organic subset: B, C, N, O, P, S, F, Cl, Br, I
~~smiles charges~~
  1. specify attached hydrogens and charges in square brackets
  2. number of attached hydrogens is the symbol H followed by optional digit

Monday, October 11, 2010

#Chemsketch#

what is chemsketch? chemsketch is used to draw molecules, reactions, and schematic diagrams and includes powerful optimization and 3D visualization tools

~~Features~~
  • Draw and view structures in 2D, or render in 3D to view from any angle
  • Draw reactions and reaction schemes, and calculate reactant quantities
  • Generate structures from InChI and SMILES strings
  • Generate IUPAC systematic names for molecules of up to 50 atoms and 3 ring structures
  • Predict logP for individual structure
  • Search for structures in the built-in dictionary of over 165,000 systematic, trivial, and trade name

~~Benefits~~
  • Visualize chemical structures in 2D or 3D to gain more insight into spatial configurations, and relationships to molecular properties
  • Create professional reports, working with structures, text, and graphics simultaneously
ACD/ChemSketch also allows you to check other tautomeric forms for your drawn structure. Consideration of tautomeric forms is very important for structure searching, predictions (such as physicochemical properties, i.e., pKa), and interpretation (i.e., of NMR, MS, and other analytical data)

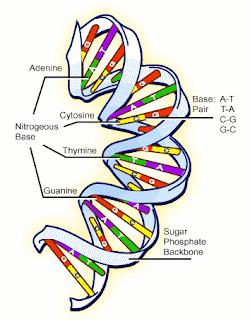
how to sketch the dna molecules in the chemsketch?


1chose draw
2Click Polyline
3Drag vertically down from the starting point of the curve to stretch the control line
4Release the mouse button.
5Move the mouse to the right to draw the curve
6Drag vertically down to stretch the control lines. By changing the length of the control lines you can modify the form of the curve.
7Release the mouse button and right-click twice to finish drawing the curve and to switch to the Select/Move/Resize tool
8Place the mouse pointer over the selected curve and, while holding down CTRL+SHIFT, drag it down (holding down CTRL while dragging leaves behind an instant copy of the object and holding down SHIFT forces the object to move strictly vertically or horizontally).
9Select both curves by dragging the selection rectangle around them or by clicking on each of the curves while holding down SHIFT, then from the Object menu, choose Connect Lines to connect the right ends of the curves
10Click Edit Nodes
11Click Connect Vertices
12click Convert to Line
13Right-click to leave the Edit Nodes mode and to switch to the Select/Move/Resize tool

Excel


~~Microsoft Excel~~

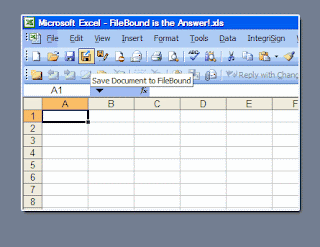
Microsoft Excel (full name Microsoft Office Excel) is a spreadsheet application written and distributed by Microsoft for Microsoft Windows and Mac OS X. It features calculation, graphing tools, pivot tables and a macro programming language called VBA (Visual Basic for Applications). It has been a very widely applied spreadsheet for these platforms, especially since version 5 in 1993. Excel forms part of Microsoft Office. The current versions are Microsoft Office Excel 2010 for Windows and 2008 for Mac.

~~Basic Operation~~

Microsoft Excel has the basic features of all spreadsheets, using a grid of cells arranged in numbered rows and letter-named columns to organize data manipulations like arithmetic operations. It has a battery of supplied functions to answer statistical, engineering and financial needs. In addition, it can display data as line graphs, histograms and charts, and with a very limited three-dimensional graphical display. It allows sectioning of data to view its dependencies on various factors from different perspectives (using pivot tables and the scenario manager). And it has a programming aspect, Visual Basic for Applications, allowing the user to employ a wide variety of numerical methods, for example, for solving differential equations of mathematical physics, and then reporting the results back to the spreadsheet. Finally, it has a variety of interactive features allowing user interfaces that can completely hide the spreadsheet from the user, so the spreadsheet presents itself as a so-called application, or decision support system (DSS), via a custom-designed user interface, for example, a stock analyzer, or in general, as a design tool that asks the user questions and provides answers and reports. In a more elaborate realization, an Excel application can automatically poll external databases and measuring instruments using an update schedule, analyze the results, make a Word report or Power Point slide show, and e-mail these presentations on a regular basis to a list of participants.

~~eXerCiSe of ExcEl~~


Conc(M)Absorbance
0.00E+000.0000
4.00E-050.0958
8.00E-050.1820

so, it will show the graph of absorbance versus concentration


Tuesday, September 21, 2010

~mApLe~

what is maple??
Maple, first released in 1981 by Waterloo Maple, Inc., http://www.maplesoft.com/
is a system for doing mathematics on a computer. Maple combines symbolic
manipulation, numerical mathematics, outstanding graphics, and a sophisticated
programming language. Maple has established
itself as the computer algebra system of choice for many computer users including
commercial and government scientists and engineers, mathematics, science,
and engineering teachers and researchers, and students enrolled in mathematics,
science, and engineering courses.
Basic Operations on Numbers, Expressions and Functions
  1. “a plus b,” a + b, is entered as a+b
  2. “a minus b,” a − b, is entered as a-b
  3. “a times b,” ab, is entered as a*b
  4. “a divided by b,” a/b, is entered as a/b. Executing the command a/b results in
    a fraction reduced to lowest terms
  5. “a raised to the bth power,” ab, is entered as aˆb

Calculate (22341)(832748)(387281)22341*832748*387281;
Calculate (5+5+5)15


Maple perform in the way intended. You will find that calculations and sequences
of calculations most frequently used by beginning users are discussed in detail
along with many typical examples. In addition, the comprehensive index not only
lists a variety of topics but also cross-references commands with frequently used
options. Maple by Example serves as a valuable tool and reference to the beginning
user of Maple as well as to the more sophisticated user, with specialized needs